Back Office Reports allows you to get a quick overview or a detailed breakdown of your reports. With clear, easy-to-read reports and charts, you can stay on top of your business performance. For deeper analysis, Insights provides interactive, pre-built reports to help you explore key metrics like sales trends, product and category comparisons, layout optimization, and staff performance.
This guide will walk you through the essential Back Office reports and how to navigate the platform to locate and access them.
What's in this guide?
|
|
|
Accessing Reports
This is our legacy reports system, which is no longer being developed or maintained. While legacy customers still have access, all users are encouraged to switch to Insights for a more advanced reporting experience.
Back Office can be accessed from any device with an active internet connection, and allows team members with Reports access to view all available data. Note that some reports may require corresponding add-ons to be enabled before they become available.
- Log in to Back Office with your Lightspeed credentials.
- In the left-hand menu, select Reports.
Filter your reports for better detail by site, register, time, products, or tags - all depending on the report.
Dashboard
The dashboard is your home page. It will give you an overview of your business for the day. This updates every 10 minutes. The summary version is found under Reports, but the detailed dashboard can be found by selecting My site in the left-hand menu.
This section includes:
- Sales total
- Best Customer, Best Staff, and Best Hour
- Sales Summary Chart
- Top Selling Products
- Sales by Category
- Top Selling Staff
Sales Summary
The Sales Summary gives you a comprehensive view of sales, including Number of Sales, Net Amount, Tax Amount, Total, and Sales Average, which can be broken down by the day.
The data here updates every 10 minutes and only counts your sales in the form of gross output, not including refunds or returns.
Sales Feed
This report updates live and is the reporting equivalent of your Sales History from the POS. You will also be able to quickly view and email customer receipts from here by clicking the magnifying glass icon.
The Sales Feed report is a raw export of your sales data. It shows the details of every sale ever made within a timeframe, including Sale #, Date/Time, Site, Customer, Tip Amount, and Total Amount. This report updates live.
Sales By
Filter your sales numbers by the user, product, category, or even filtered by unique reporting tags. The Sales By report will not only give you a unique breakdown of your revenue, but will also show you your cost prices and Gross Profit percentage, which also updates every 10 minutes.
Snapshots for the top three filters used most regularly by our customers are shown below;
-
(Sales By) Product: Identify the best-selling product and how products rank by quantity, sales amounts, cost, and gross profit percentage.
-
(Sales By) Category: Identify the best-selling category and how categories rank by quantity, sales amounts, cost, and gross profit %.
Products in more than one category are merged into a Products in Multiple Categories field, and products in no categories are shown as Products in No Category.
-
(Sales By) User: Identify your top staff and how your team ranks in terms of sales contribution.
Hourly Sales
This report gives a perspective on how busy your business is, helping you plan staffing and other resources accordingly. This report updates every 10 minutes.
The top-level filters here are Sale Amount, Sale Count, and Average Sale.
You can view this as:
- Sale Amount Summary Chart: Display hourly data for total Sale Amount, Sale Count, or Sale Average.
- Weekly Comparison: Displays a comparison of sales performance across different weeks.
Reconciliation
The Reconciliation Report is a granular look into your takings and includes subreports such as Payment Breakdown, Sales, Payments, Tips, Money In/Out, and Adjustments.
Unlike the other reports that update regularly. This report only gets updated once the staff finalises takings and is, therefore, point-to-point. So if the staff forget to do takings for one day, the next end-of-day takings done would encompass the skipped day and the day itself.
The Reconciliation Report includes the following subreports:
Reports
This section provides a breakdown of all takings based on your selected filter.
- Counted: The counted amount is automatically counted with your integrated payment terminal (for card payments) or manually entered by your staff (for non-card payments).
- Recorded: Total expected from all sales for the period, inclusive of money ins and outs, and refunds.
- Variance: The difference between Counted and Recorded.
Cash variances are common, however, we highly recommend familiarising your team with the correct takings process to ensure that the data is accurate each day to quickly identify variances.
Payment Breakdown
This focuses on the payment methods within the chosen report. For each payment method, you'll see the payments, refunds, money in/out, and tips, all of which contribute to the recorded, counted, and variance amounts.
Sales
This report is similar to the Sales Feed but displays only the sales made during the selected takings period. You can also view and email receipts by selecting the magnifying glass icon beside the sale record.
Payments
This is raw data on all payments made within a takings period including the gratuities.
Tips
This is a summary of gratuities, to whom it’s going, and if it has been withdrawn as cash.
Money In/Out
This is a summary of float in/out, as well as tips withdrawn from the cash drawer.
Adjustments
This shows a summary of price adjustments, the reason behind the adjustment, and the products to which they were applied.
Comparison
This report allows you to build a comparison report between two chosen periods. You can compare the number of sales, the sales amount, as well as how many items are sold.
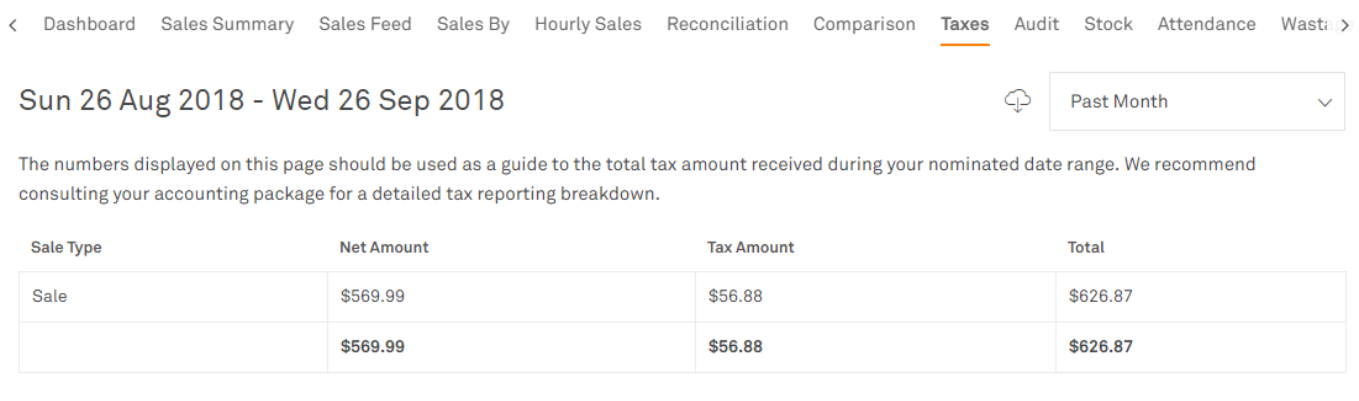
Taxes
The Taxes report provides a simple breakdown of your taxable amounts based on your sales. The figures are rounded off to the nearest 2 decimal places.
 Audit
Audit
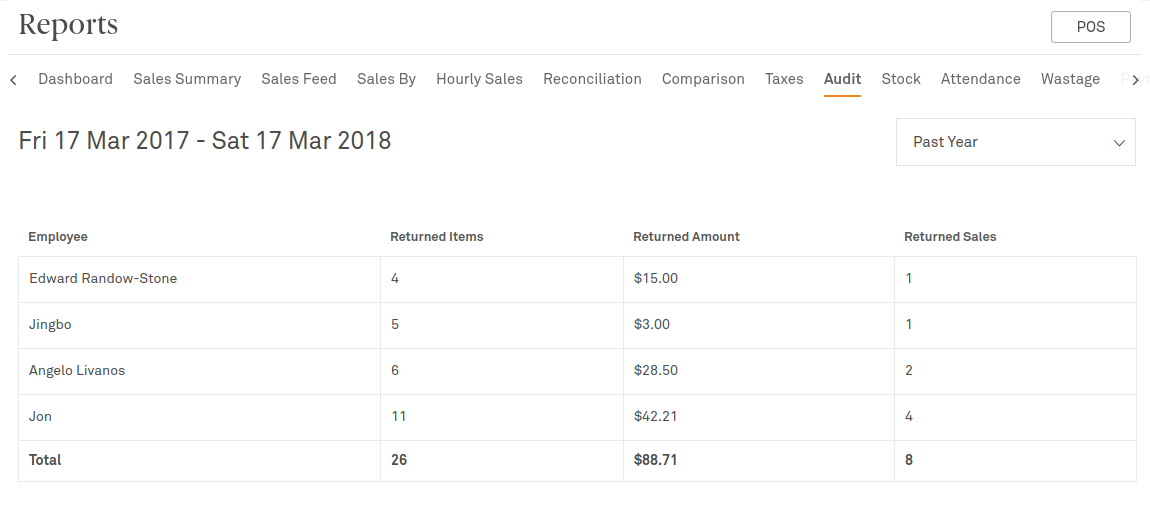
This report shows detailed audit data on all refunds and discounts processed by your team.
Track the number of sales/products, as well as the lost revenue from each discount or refund, to easily identify any excessive breaches of permissions.
 Stock
Stock
If you have the Stock counts add-on enabled, the stock report will give you a live count of all stock currently on hand and their cost.
Attendance
If you have the Time & Attendance add-on enabled, this report will provide simple data based on when a user logs in or out of Lightspeed on a day-to-day basis.
You can also integrate your Time & Attendance data to Deputy, KeyPay, Tanda, or any of our other integration partners.
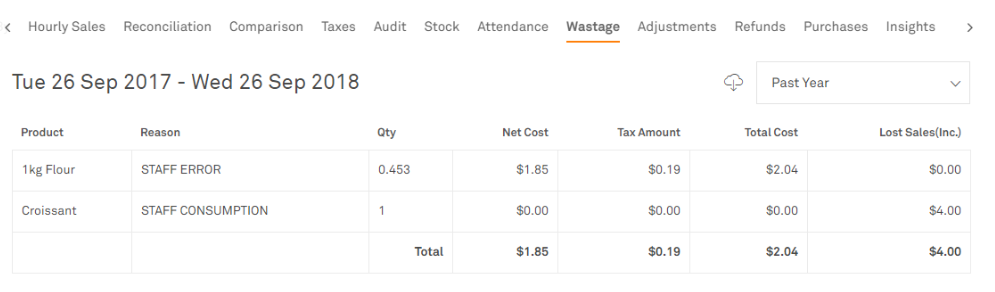
Wastage
Once you enable the Wastage add-on, this report will provide a complete report of all products or ingredients that were entered as wastage, so you can track by wastage reasons, product type, or lost revenue.
 Payments
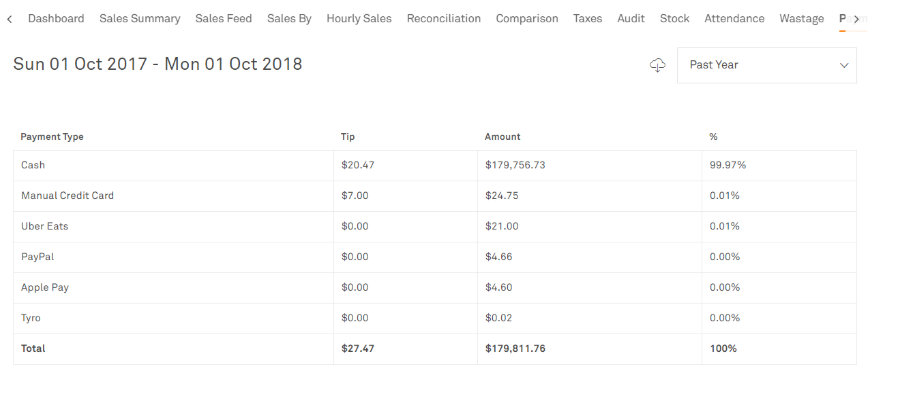
This report is only accessible if you have integrated payments. This is a summary of payments (similar to the Payments subreport under Reconciliation). This report shows the total amount processed for each payment type and the percentage this represents against your total revenue.
 Adjustments
Shows a detailed breakdown of all price adjustments and promotions. View in either Summary or Detailed to see the reasons behind them, the products involved, and the lost revenue.
This is a great report for seeing how well your promotions are performing.
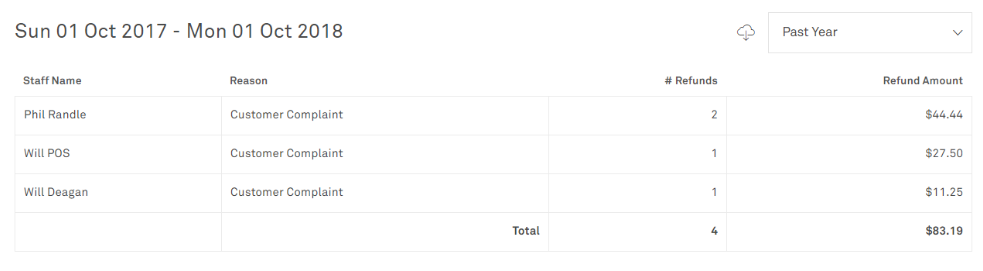
Refunds
A summary of refund amounts and the reason behind the refund, where you can filter by time, user, and reason.
 Guests
Enable the Guest Tracking Add-on and start reporting on average spend per head, or pair with the Tables add-on and track your dine-in vs take-away orders (Sales with Guests vs Sales without Guests).
Purchases
For this report to be accessible, you would first need to subscribe to Purchase. With Lightspeed Purchase, getting stock into your business is simple, traceable, and connected to your inventory, reporting, and accounting systems for dreamlike efficiency.
The purchases report will show you your total received or drafted purchase orders for any given period, and filter based on specific products, categories, or suppliers.
Insights
Our newest product, Insights, lets you quickly see your data from all of your companies and sites in one spot so you can make decisions faster and more confidently than ever.
With a library of pre-built dashboards, powerful filters & drilldowns, and automated report scheduling, you have the power to find hidden profit opportunities.
Frequently asked questions
Use the cloud icon with the downward arrow to download your data as a CSV file, and then open it using Excel, Numbers, Sheets, or similar apps. You can export reports from any device logged into the Lightspeed Back Office with the Google Chrome browser.
The reports are updated live or every 10 minutes (report-specific). Naturally, the Reconciliation report is updated once a taking has been finalised.
What's next?
In need of more advanced data analytics? Take your business intelligence to the next level and contact one of our experts today.
Talk to our Experts